|
Predicting Karl, ie Karlcast, is going to require collected a huge number of images of Karl and relating those images back to certain times of day, atmospheric conditions, ocean water temperature, etc. Following up on the previous post about image collection, I've written a couple of python pipelines: one that initializes and then populates a pandas dataframe with data from a given GOES16 satellite channel, and one that updates a given dataframe with new information. Regular updating is probably the easiest way to build a big enough dataframe, as it requires only interaction with the RealEarth API. It has its drawbacks though- I'll have to wait around for enough data to be posted, and this pipeline--and the data--are on my local machine. Before Karl's shape and extent can be predicted, it's a good idea to take a more global look at the data. To that end, I've simply converted images of Karl to flattened numpy arrays and taken their sum- in other words, a measurement of total Karl. As can be seen below, there is a clear relationship between time and Karl over a four-day testing window. 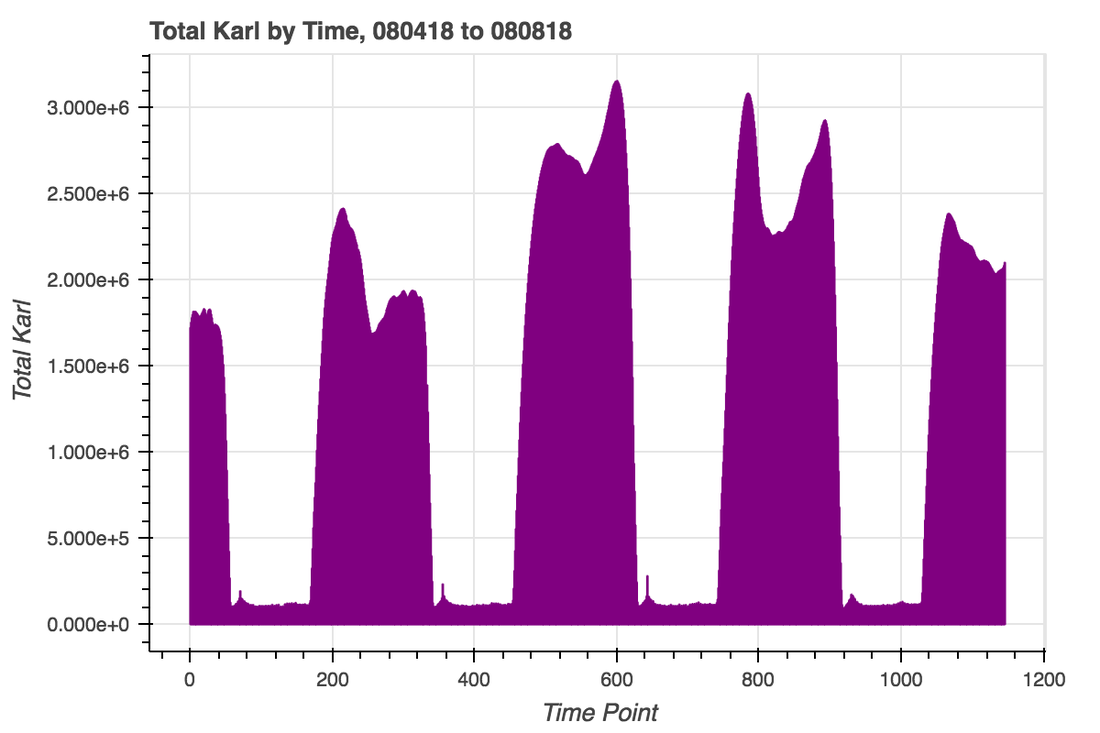 Next, we can bin that data by hour to investigate the shape of daily trends. There is clearly a strong trend by time of day, as well as a fair bit of heterogeneity around the peak and a long 'inactive' trough. That heterogeneity and inactivity are both important considerations in how a downstream ML model is built- the heterogeneity provides some structure that could aid in fine-scale predictions while the weight of the inactive periods may need to be adjusted to avoid a simple bimodal Karl prediction. 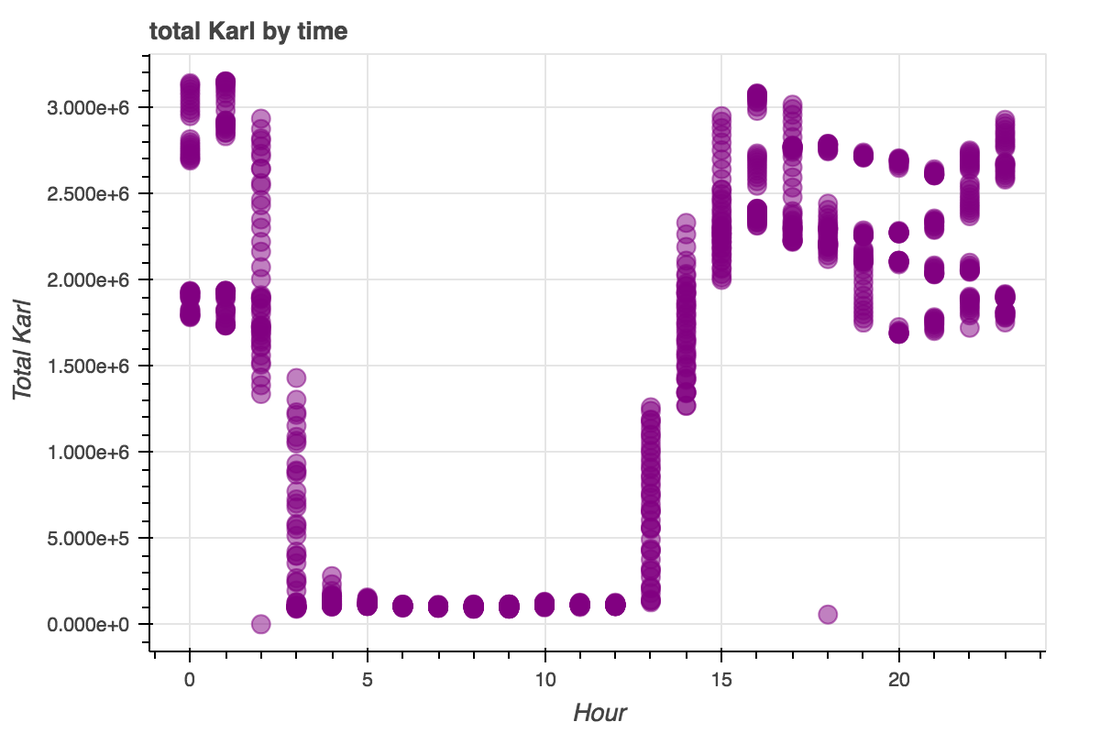
1 Comment
2/10/2021 01:28:30 pm
Leave a Reply. |
AuthorWrite something about yourself. No need to be fancy, just an overview. ArchivesCategories |
 RSS Feed