|
Olfactory receptor genes are found on all chromosomes except the Y, generally in clusters. Assessing their quality by cluster or location (by quality, I mean anything ranging from amino acid composition to expression level to function) can be a useful means for hypothesis development. For example, plotting by genomic location will tell you if a subset of receptors sharing a common feature such as expression level are also neighbors, which could point you in the direction of potential cis-regulators.
Much of my data was produced by other people, often without gene names, chromosome numbers, or genomic coordinates attached. To collect this data without too much work, I take advantage of the very cool biomaRt package, which allows queries connecting a dizzying array of related types of biological data across a multitude of genomes. Next, I use CMPlot to generate 'manhattan' plots, which typically are used for genome-wide association studies. In my case, rather than including SNPs or a p-value as is typical, I'll include an activity or expression value and simply change the axis title. Among the cool and easy tools provided by CMPlot are those allowing both linear and circular manhattan plots. I saw a circular one ages ago and haven't put in the work to make one myself until recently. As can be seen on the plot below, generated with slight modifications from the code (for example taking advantage of the 'outward' argument), the outer ring corresponds to chromosomal location. Banding on the ring occurs at OR clusters, for example in the middle of chromosome 2 where an especially large cluster is found. Looks like something interesting is happening in that cluster... 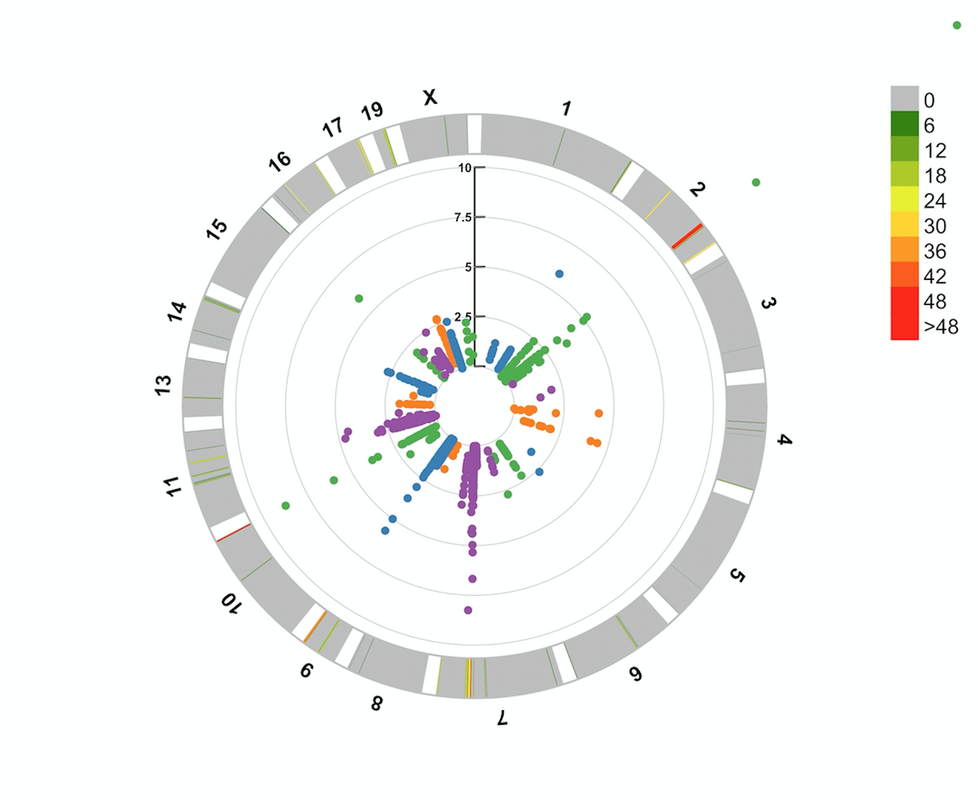
|
 RSS Feed
Proudly powered by Weebly