|
Transit Shapes Cities but We Shape Transit There are few city-shaping forces more powerful than transit. Think about it: when you imagine New York City, you probably think about how easy it is to hop on the subway and miraculously appear on the other side of the city (at least it seems like a miracle in comparison to what we have in the west). When you think of Los Angeles on the other hand, you might conjure an image of being stuck in your car in an endless tangle of freeways. But the means of transit that we employ goes beyond simply shaping our physical cityscapes. It also makes up much of the fabric of our day-to-day lives. It helps to determine what's in our shopping baskets (I'm probably not going to bike home with a case of cans from Costco any more than I'm going to drive an SUV to the cornerstore to grab a tomato). That in turn shapes the makeup of our local businesses. It influences our health, by guiding how and when we're active. And it guides the ways in which we build and interact with our communities. In short, transit connects us in more ways than one. Because of the ways that transit shapes us as a city and as a people, it's important for us to be mindful of how we shape transit in turn. Here are a couple recent(ish) examples: after the '89 earthquake in San Francisco, the city opted not to rebuild some of the damaged freeways. This led to a revitalization of areas like Hayes Valley and the Embarcadero and also contributed to the pedestrian, cycling, and public transit culture in San Francisco. Here's another example: restricting public transit has the effect of restricting access to jobs and education. More accessible transit is an engine of equity, and suppressing transit has historically been a means of racial and economic segregation. With that said, let's look at how Angelenos move. The below data were collected from datausa for the year 2017. They show the share of work commuters using five types of transportation: driving alone (as in, no one else is in your car), public transit, biking, walking, and 'other' (which includes taxis and work-from-home). 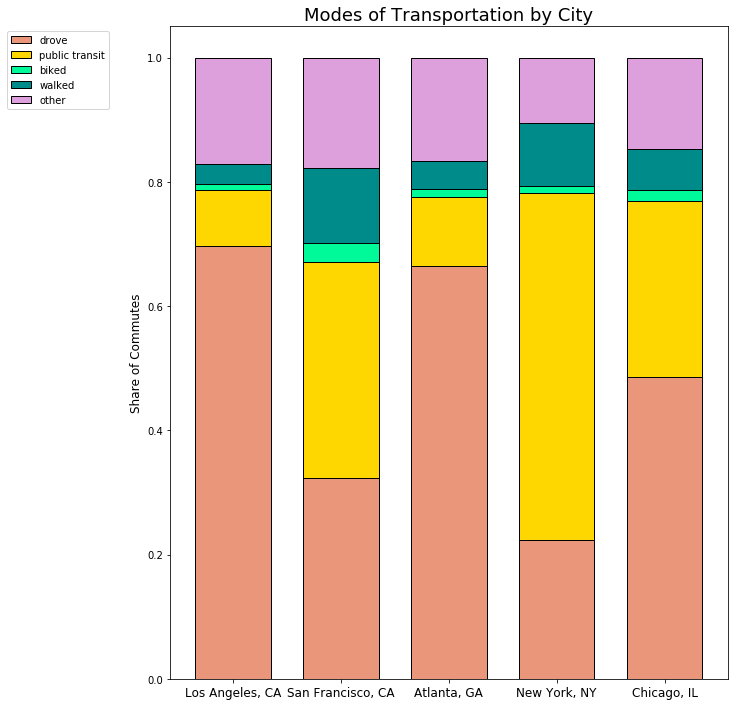 There are a few take-aways from these data. One is that the proportion of commuters using public transit varies widely from city to city. But I've chosen these cities in particular to highlight a different point: Angelenos overwhelmingly get around in cars (by themselves). No one in Los Angeles would be surprised by this. But many would be surprised to know that by this metric, LA looks a lot like the urban south. When I've discussed this data with friends and colleagues here, perhaps the most common rebuttal that I've encountered is: Los Angeles is enormous, and the only way to get around is by car. Is that true? The first part certainly is. LA is a megacity. But when people get into their cars, are they always driving across the city? I'm not asking about your friend or cousin who commutes from the Valley to Long Beach, or from Pasadena to Santa Monica. I'm asking about the average. And when it comes to the data, the answer is no: Half of trips in LA are shorter than 3 miles 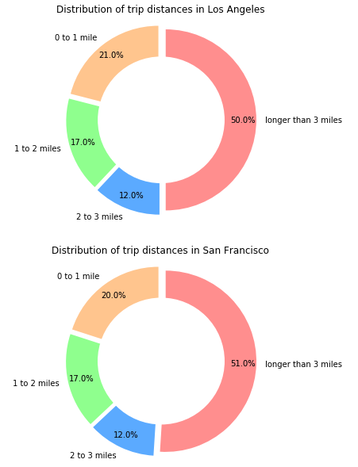 I collected and crunched the above data from a recent report from INRIX, which first came to my attention after it was posted on BikinginLA. These data indicate that 21% of trips taken in LA are less than a mile. And ~50% are less than three miles. I found this to be pretty striking, when compared to the distribution of how people get around. Because what these data say, according to INRIX, is that Los Angeles is one of the best candidates nationwide for 'microtransit', services like bike-share and scooters. INRIX seems to have a point: "scooters and bike-share are transforming LA" is a quote I've heard more than once recently. And to hear cyclists (and some walkers) tell it, the barrier to biking or walking is not the 3-mile mark; it's the lack of contiguous bike and pedestrian infrastructure. But am I only talking about fun neighborhood trips? Aren't Angelenos still stuck in their cars because LA commute times are especially long? It turns out that LA is pretty typical in terms of commute time, with an average of 29.8 minutes compared to the national average of 25.1. There is a rather long 'tail' in LA's commute times, but the proportion of people with long commutes is not very different between LA and the national average. And better transit policy will help that. Below I've plotted a histogram of the average commute times of all 399 California cities listed by datausa. LA is marked in red so you can see how we stack up. 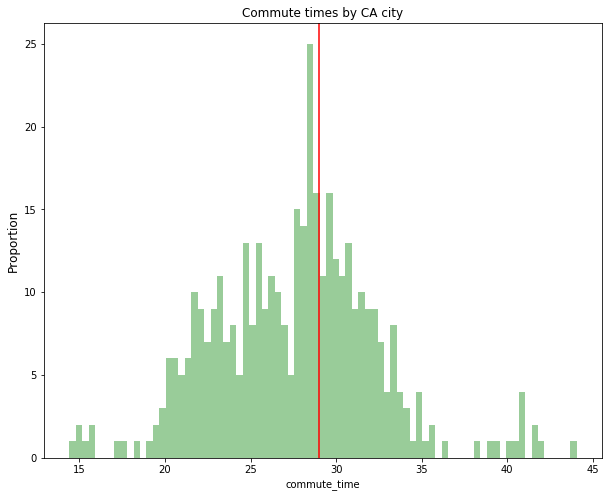 If you're curious about the identities of the outliers, on the short end are cities like Santa Barbara, Napa, and Chico. On the long end are cities like Pittsburgh, Antioch, and Richmond. Those names probably sound familiar to Bay Area BART users: they're the end-points of BART lines. This is a terrific piece of information to fall out of this analysis. Why? Because it suggests that public transit is keeping financial/employment centers accessible even as those centers become unaffordable to live in. Pittsburgh, for example, is ~40 miles from San Francisco. Leave your car keys by the door Circling back to how I opened the post, our means of transit is a powerful force in the shape of our cities--how they look, their relative equity, their integration. In the public discourse, LA is generally regarded as a behemoth in which the personal vehicle is the only possible means to get around. But according to these data, Angelenos are mostly taking neighborhood trips, like everybody else. We know that to be true from experience, of course. As satirized in movies like LA Story, many Angelenos insist on driving even when it would be faster to walk.
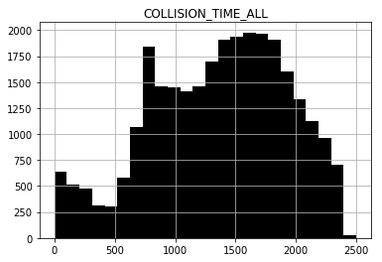
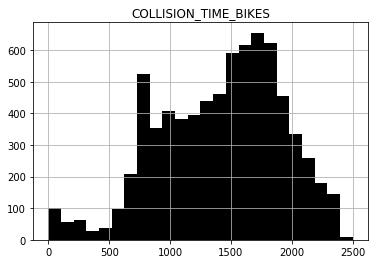
What this says to me is that LA is culturally a car city, but it is not one by necessity. And that's good news, because it means that we can adapt. How? By leaving your car keys at the door. Using transportation other than single-occupant cars is a meaningful action. Your increased ridership on the Metro will factor into whether and where Metro expands. Your miles on the bike and on foot will factor into whether new bike lanes or improved pedestrian infrastructure are adopted. And most importantly, if you're supporting alternative transportation, you're supporting the transformation of your city into a greener, cleaner, safer, and more equitable place. Those seem like destinations we can all agree on. Continuing to dig into the granularity on cycling deaths and injuries in Los Angeles, I've developed a bit of python using geopandas to determine which districts are most dangerous. Note that this data is not normalized to the population per district. Districts have a pretty consistent population size, varying by about 10%, and effect sizes between districts are large enough to explore the data without normalizing. Again I'm looking at all bicycle accident reports from 2015-2018 and vehicle accident reports from 2018 only. All accidents, according to the datasets referenced yesterday, are labeled with collision severities of 1 to 4, where 1 = fatal; 2 = severe; 3 = moderate; 4= minor. By looking at type 3 versus type 4 bike accidents per district, we can make some interesting inferences. First off, there is quite a bit of variability in the absolute number of accidents by district. That's certainly an angle we can dig into a bit. It's also a result that could change when (and if) we can look at ridership data instead of absolute counts of accidents. There may be far more riders in district 5, which would skew these data even if the per-rider or per-mile risk is not high. 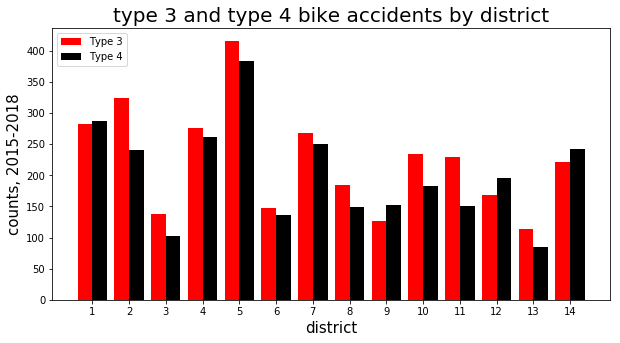 Secondly, if we look at the proportion of accident severities as a function of vehicle type, we observe a skew away from minor accidents on bikes: 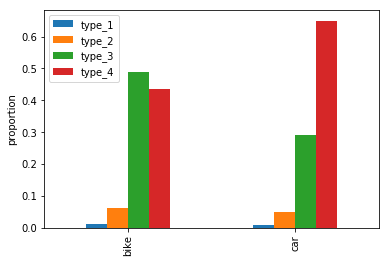 There are a couple of likely factors to explain this skew. One of them is that bike accidents are generally considered less likely to be 'minor'. Indeed, bike and pedestrian-involved accidents account for around 10% of LA collisions but almost 50% of fatalities. But I think we're also seeing something else in the data, and it is probably important: underreporting. Remember that this data is from police reports, and so if there's no report, the incident doesn't appear in the data. Why do I suspect underreporting? By some accounts, ~50% of minor cycling accidents do not wind up on a police report. There are plenty of studies on this phenomenon. Some reasons: (a) bike vs car accidents that only involve property damage to the bike (or minor injuries) might be settled informally. I once went over a motorist's windshield but escaped uninjured. He promptly brought my bike and I to a bike shop and covered damages directly. Such an exchange would be difficult with vehicles. (b) some bike accidents don't involve motorists and therefore are less likely to have an insurance trigger. Most of these will be minor, because major accidents are more likely to require police/EMT support. In contrast, single-vehicle accidents are more likely to be reported even without injury. (c) rates of hit-and-run may increase for cyclists/pedestrians vs motorists. Why? Motorists might not realize they've hit someone. Alternatively, given that only ~1% of hit-and-runs are successfully prosecuted, many drivers may opt to leave the scene of an accident if they don't think they're going to get caught. On a bike or on foot, your chances of catching up with a driver are next to zero. That's probably part of why 80% of fatal bike/pedestrian incidents are hit-and-runs. (d) some cyclists who try to file police reports are unable to do so. This sounds strange--and it should sound strange. But if you speak to LA cyclists, you'll find that it is not uncommon to request--and not get--police support. It is true that LAPD resources are stretched thin. But that doesn't resonate when, for example, a task force is assembled to deal with scooters. I'm not saying that scooters don't annoy me. But public resources are better directed towards public safety, and if I had to choose between being hit by a scooter running a red light and a truck running a red light, I would choose the former. And so I would rather direct enforcement efforts towards the latter. All of these factors would contribute to underreporting. Just to drive this home, let's look at the 'minor' versus 'moderate' accidents in cars, by district. As you can see, there are roughly double the number of 'minor' accidents versus 'moderate' accidents in cars. I.e., these data look the way you'd expect them to: minor accidents are more common. 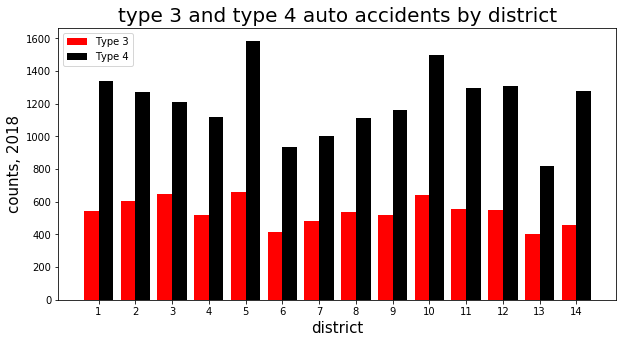 Why should we care if minor bike accidents are underreported? A couple reasons. Here's one, by way of analogy: people in certain communities (lower S.E.S., immigration status, etc.) are less likely to report even very serious crime. This can drive a deflation in incidence statistics. And that deflation ultimately results in a lack of mitigating enforcement, amplifying the risks faced by certain communities. Robust statistics (can) help cities, police departments, etc., make good decisions in how resources are allotted. They can also identify inequities in safety/service that have economic causes. Here's another reason: minor accidents can precede larger ones. You might call the city to report a pot hole on your commute that gave your car a flat tire. And they'll fill it (well, sometimes), because flat tires come with an economic and labor burden for city residents, and also because a minor accident can easily become a major one. This is the case for cyclists as well. A trouble area that accumulates many minor accidents may also experience major ones, and that can result in significant challenges to public safety. It can also get the city sued: for example, buckled and fragmented pavement (on Griffith Park Blvd, eg) has given me more than one flat. And it has also seriously injured/killed cyclists, resulting in multimillion-dollar payouts by the city. In these cases, minor accidents--probably with cheap fixes--likely predicted larger ones. The lesson--and the hope for the future--is that the power in data might be more fully realized, in order to make our streets safer. It's a daunting task. But consider an adjacent issue: recovering stolen bikes is not an enforcement priority for most police departments. Bikes are not expensive enough, they're mobile, and generally bike owners haven't held onto any way to prove ownership of them. In some cases, local PD just won't act, even with documentation (speaking from personal experience here). But the National Bike Registry project has been changing that, by creating a paper trail around bikes, and by acting as liaisons. In the process, they've subtracted reasons for non-enforcement. They've even helped some bikes to get home safely. And at the end of the day, getting home safely is all that anyone is really asking for. Following up on my post yesterday, I've continued to dig into the statistics on traffic safety in the city of Los Angeles, with a particular emphasis on safety for pedestrians and cyclists. As I noted yesterday, this seems pretty urgent: half of the people killed on Los Angeles streets by vehicles are not driving one at the time. Those numbers stand to get worse, as environmental movements and changing urban realities move more people out of cars. Don't take my word for it: last year there were 21 cyclists killed on the roads in LA County, tying 2016 as the deadliest year on record. As of today, there have been 17 cyclists killed in LA County in 2019, and we've still got four months to go. There is plenty of debate around how best to address road safety in LA. But what is clear is that if the city wishes to prioritize safety and access above speed, it makes sense to identify places--intersections, corridors, times of day, etc.--where serious injury and death are more likely. To that end, I've put together a bit of code to explore data on bike accidents, car accidents, and the places where they happen. The attached images are from a jupyter notebook, developed in python and with use of numpy, pandas, and the google maps API. The raw data is from 2015 through 2018 and is drawn from UC Berkeley's excellent Transportation Injury Mapping System. To get started, here are some histograms on the time at which motorist (left) versus bicyclist (right) collisions are taking place. The similar shape between these two histograms suggests that people are using their bikes in the same way people are using cars. This is why you see peaks around rush hour. [[Incidentally, on my ride today a motorist asked me to get out of their way so they could 'get to work', but getting to work was exactly what I was trying to do on my bike.]]
Things get a bit thornier if you dissect bike and traffic accidents by day of the week. As you can see below, traffic accidents gradually increase over the week and then drop off for the weekend. Note that Day 1 = Monday and Day 7 = Sunday on these plots. Traffic deaths don't follow the total accidents trend, meaning that the 'rate' of deaths per mile driven might not be fixed. In contrast to motorists, bike accidents peak mid-week. Unfortunately there is not much data out there (at least that I've found) on how much cycling is actually happening, which really weakens what can be done with this data. Still, total accidents, when observed over a long enough time scale, are a pretty good proxy for total use. 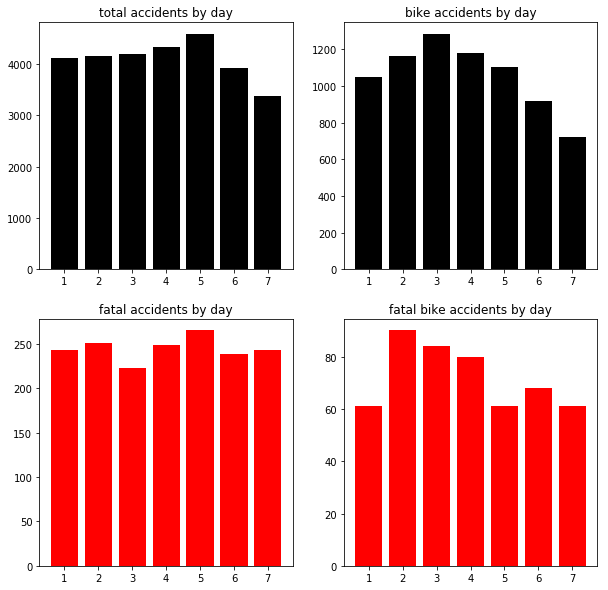 And finally, as a starting point for asking about which neighborhoods and times are the most dangerous for cyclists, I've taken advantage of the google maps API to plot all cyclist accidents (with motorists). This is represented by the heat map below. Overlayed on it are the 'severe injury' and fatal bike accidents. While this map is static, the python notebook is on my github to play with. Next time, I'll start to divide these accidents over time, and will ask whether there are zones in the city where the proportion of bike accidents that are fatal is higher than expected. 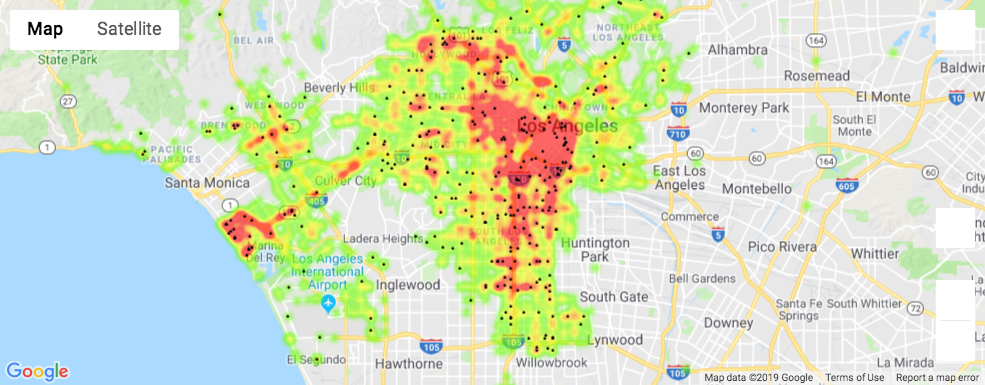 I'm just going to put it out there: I commute by bike in the city of Los Angeles. Every day, and about 8 miles in either direction. When I reveal this fact to Angelenos, the most common reaction is despair. Some of them despair for me: for my (unsure) physical health on the streets, for my (unsure) mental health as a person who would want to be closer to the pavement. And some despair for themselves, for that inevitable moment when they'll have to decide between running me over and...well, getting to the next red light a few seconds later. This tension is frequently borne out on the road: though I've commuted by bike across the whole hipster circuit--New Orleans, San Francisco, Portland, Oakland, and Beijing--I've never had so many close calls, nor so many *intentional* close calls, as in LA. But I still love biking in LA and I'm going to keep doing it. It's great for my physical and psychological health, and though I cross the city on my commute, I know down to within a minute or two how long it'll take, regardless of the time of day and regardless of traffic. Moreover, it's better for the environment and better for our air quality (we've had >60 straight days of bad air), and it's a new way to see the city. Put an Angeleno on a bike and they'll see places they'd never heard of. Still, given the safety concerns with riding, I've started to dig into some data on how LA compares to other metro areas when it comes to road safety. LA is a Vision Zero city, meaning that it aims to end traffic fatalities by 2025. That's a tall order: in 2016, ~130 pedestrians were killed by cars. And so far in 2019, 17 cyclists in the LA area have lost their lives in traffic. So is LA going to realize this vision, or is the vision a mirage? This will be the first of several posts on the matter. To begin, let's look at some data on the state of affairs on LA streets. [[My main data sources are LA's Vision Zero manuals and progress reports and the US Department of Transportation Traffic Safety Facts compilations, published each year. Here's 2016. Analysis is all in python, using matplotlib, numpy, and pandas.]] Am I Going to Die Here? A good starting point would just be to ask: what are the chances I'm going to die in my city in a traffic accident? As you can see below, in 2016, roughly 7 people of every 100,000 in Los Angeles died in traffic. 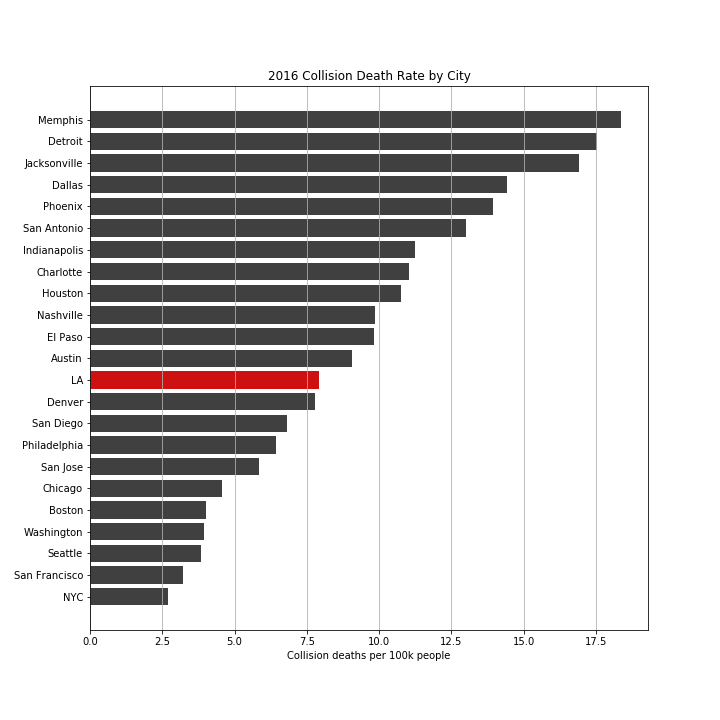 Is the collision death rate in LA acceptable? That depends on whom you ask. If you're asking the Vision Zero city of LA, then the answer should be a clear no. If you're asking drivers, who likely want to balance convenience and safety, then this may be an acceptable rate, albeit one they don't want to think about. If you're asking me, as a 'vulnerable' road user, the rate is way too high. Getting to work, to the gym, to the theater, etc., shouldn't mean someone gets killed. I'd like to see LA achieving a more 'progressive' number. And I would guess that the majority of Angelenos would too. It is telling that the LA number is closer to what is observed in Houston and Nashville than what is achieved in Seattle. Are Things Getting Better? Another question you might ask is: are things getting better? After all, since the city signed on to Vision Zero back in 2015, new crosswalks and bike lanes have been going in, and supposedly enforcement has been stepped up. But it seems that not enough is being done. Below, I'm comparing data from 2012 and 2016 (the most recent available report). Most of the cities on the plot, including LA, actually saw significant increases in their collision death rates over this span. 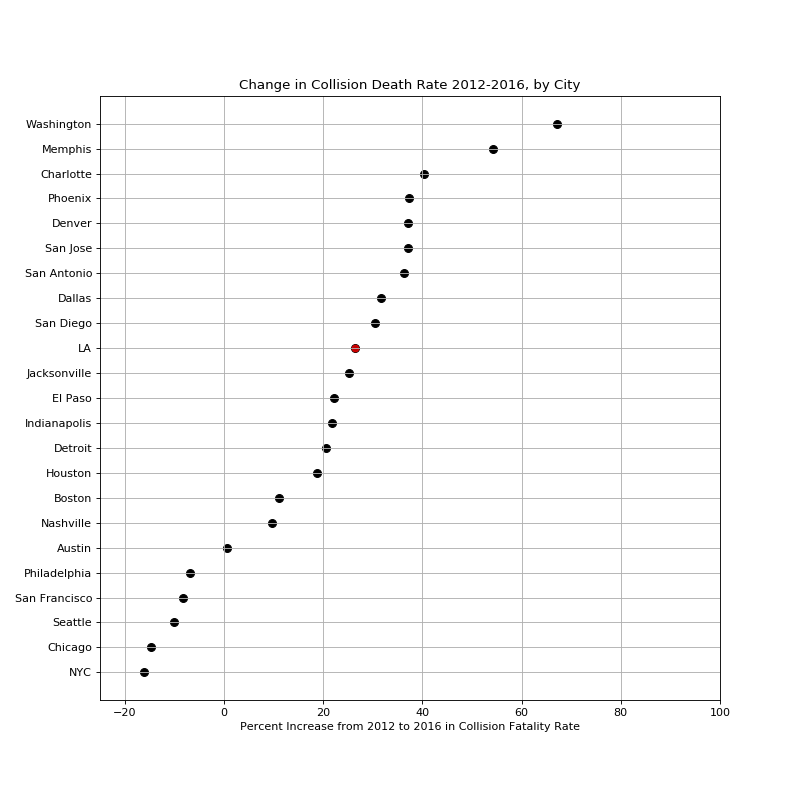 To put this into perspective, it helps to actually see the raw numbers. In 2012, LA saw 242 traffic deaths, 99 of which were pedestrians. In 2016, there were 315 traffic deaths, of which 135 were pedestrians. Note that (according to LA's Vision Zero progress reports) the number of people killed while walking in LA each year is often higher than the number killed in cars. That is a very, very dark statistic. It's also an indication that increases in vehicle safety are failing to translate to safe streets. That's where policy comes in (or is supposed to). What's happening? Geography is a Major Factor One thing that is very clear from these data is that your likelihood of dying by car very much depends on where you're driving it. The exact mechanisms behind that observation are likely a good object of study for anyone trying to build safer cities. Towards understanding these mechanisms, I have a couple more plots below. In the first, I've simply plotted the 2016 Collision Death Rate against the per capita income for each of the test cities. As is apparent, if you live in a rich city, you're much less likely to die by car. This is not necessarily causal. But there is good reason to suspect that economic factors have much to do with whether or not you will die by car: more expensive cars on better-cared-for roads are, all things equal, less likely to get you killed. Though, as I'll describe later, economic factors also influence pedestrian rates, which skew the total death rates. [[As a side point, as a scientist I'll note that there's plenty to learn from outliers. It's worth taking a closer look at the cities that significantly depart from the trend line below. Cities above the line, like Memphis and Jacksonville, are more dangerous than expected. This could be due to a number of factors, including sprawl, traffic laws, and wealth distribution. There are also some cities below the line, like LA and New York. Are they below the line because they're working hard to make transportation safe, or because unrelated urban planning has decreased traffic speeds? It would be good to actually test this using some historical data.]] 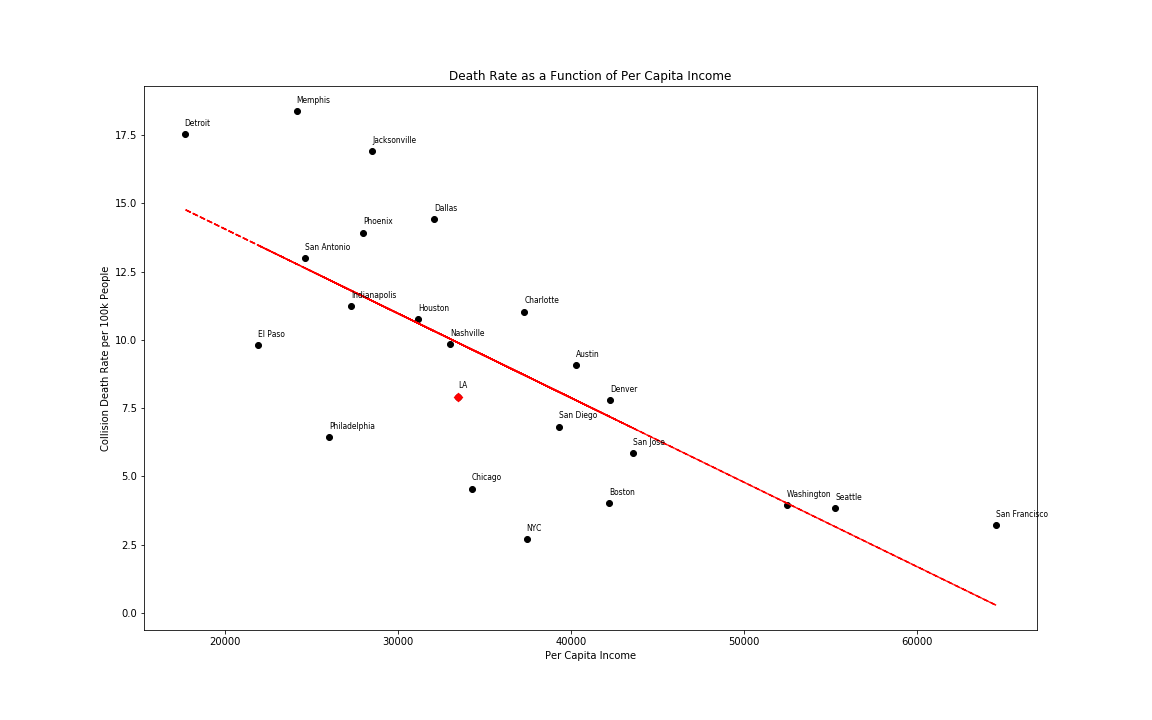 Voting Could Save Your Life As a final note, I've compared the Collision death rate in major American cities to the percentage of votes cast in those cities for Hillary Clinton in 2016. Note that this is not an endorsement of Clinton. There are many factors built in here, including economic ones, as discussed above, and it would be blatantly unscientific to draw a political conclusion when I've just argued for an economic one. I've included the data to make a broader point: good transportation is a key part of the progressive agenda. Good transportation is also a nexus between climate and social policies. And it just might save your life, or the lives of your loved ones. So vote with that in mind. And just as importantly, *live* with that in mind. If you don't want to walk or get on a bike, then at least give us some space. 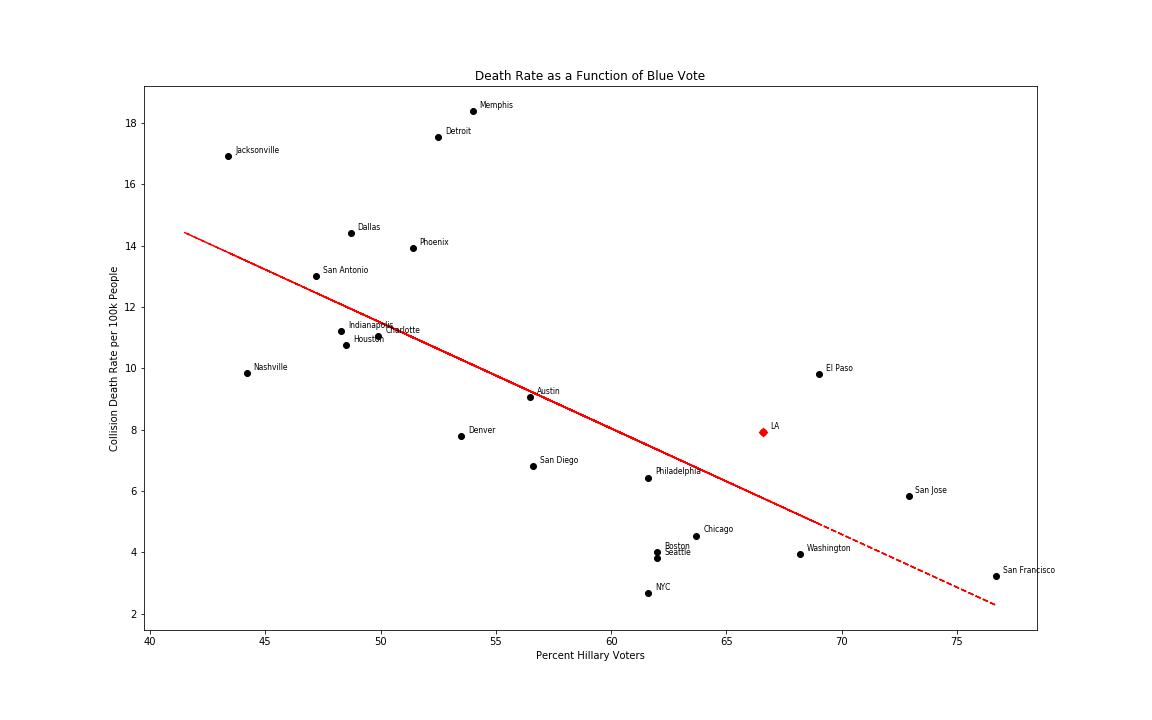 |
 RSS Feed
Proudly powered by Weebly