|
The largest gene families known in nature are those encoding the olfactory receptors. Each olfactory neuron in the olfactory epithelium expresses a single olfactory receptor gene from a gene family of ~1100 (if, in this case, the 'you' is a mouse). Thus, whereas you have three different color photoreceptors to segregate visual information into red, green, and blue at the point of detection, olfactory information is initially segregated into ~1100 channels.
A recent technical advance, termed 'phosphorylated ribosome capture', has allowed for the biochemical purification of mRNA from neurons that have been repeatedly activated. This approach is invaluable for stimulus mapping, which remains a difficult problem in neuroscience. These posts will detail how I have used this approach to measure the activity of the ~1100 types of olfactory neurons simultaneously, in response to stimulus presentation. A fair way to think about this is as an 'olfactory snapshot'. For more information on this approach, see the Knight lab, who developed the approach, or the Matsunami lab, who first applied it to map odorant ligands to olfactory receptors. To control for the variability in expression levels of olfactory receptors, this data is generally viewed in terms of normalized enrichment. Our enriched dataset is generated by purifying mRNA from activated neurons, while our input dataset is generated from the whole tissue. Enrichment for a receptor indicates the probability that a given cell expressing that receptor has been activated by our stimulus. Thus, if our biochemical purification sample yields 10 reads of receptor A and 5 of receptor B, but our total sample (ie input) contains 5 reads of receptor A and 10 of receptor B, the enrichment value for receptor A is 2, and for receptor B is 0.5. The probability that a given receptor A is activated in this condition is therefore 4x greater than the probability for receptor B. In the data given below, I'm making a first pass at asking whether, as a family, olfactory receptor activity is modified between two conditions. To do this, I simply read in the data, normalize it, and plot all data in a linear fashion (in this situation, receptors are simply ordered according to gene name). What immediately jumps out is that the spread of the data is different between the conditions- in other words, one condition is 'noisier' than the other in terms of olfactory receptor activity: 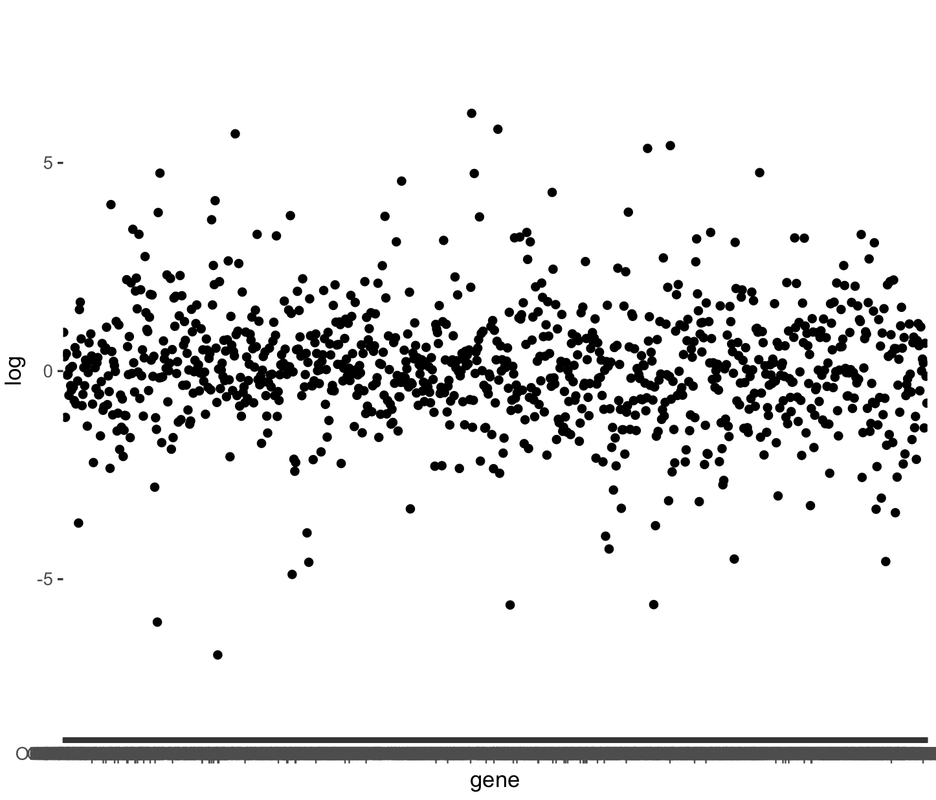
|
 RSS Feed
Proudly powered by Weebly