|
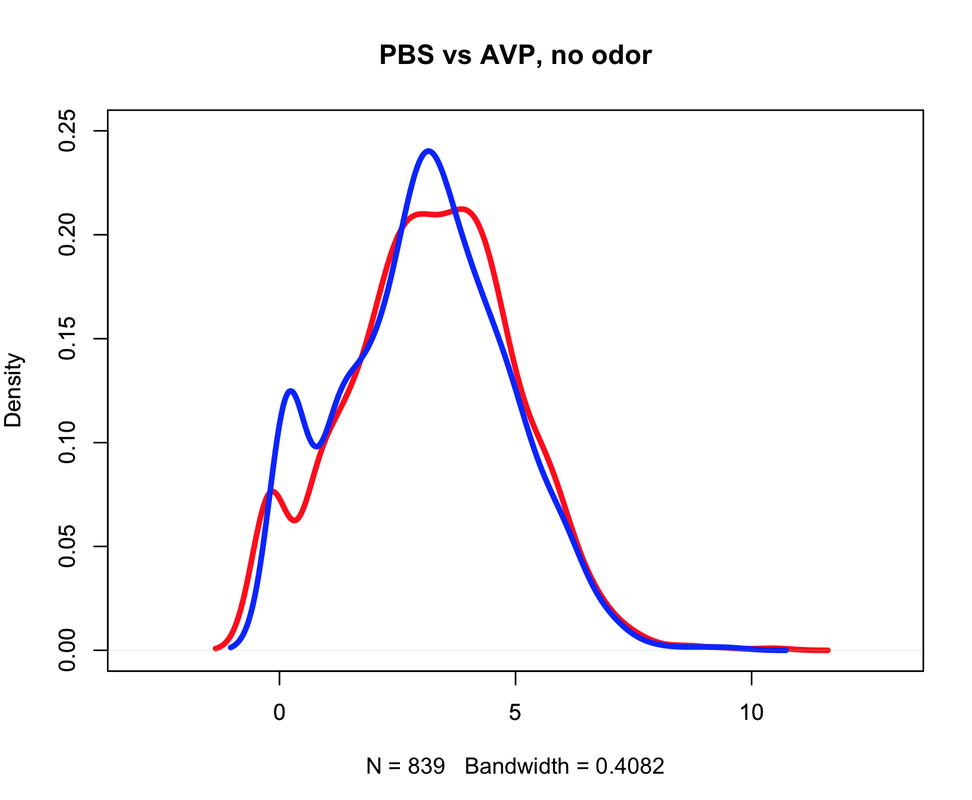
Another interesting way to look at the same data from posts I and II is with density plots. Density plots are essentially continuous histograms. They therefore allow us to look at the distribution of activity values across the olfactory receptor family and to compare distributions from different experiments. One of the interesting features of these graphs is that they can give us a good idea for the variability across the gene family for activity values. Noisier encoding of olfactory information would be expected to give a broader distribution, while less noisy encoding would give a tighter distribution:
|
 RSS Feed
Proudly powered by Weebly