|
In a previous post, I used data from a phosphorylated ribosome capture experiment to look at the 'activity' of the olfactory receptor gene family. Looking at all of the data arrayed according to gene name was not especially informative however. In this post, I will use this same data to generate a qqplot, which compares the distribution of our datapoints with a randomly-generated normal distribution.
The most exciting thing about this data is not that it gives us insight into which specific sets of olfactory receptors were activated (it doesn't). What's more interesting is that if we generate a qqplot from data collected from animals that were presented a stimulus, we find variability in both directions. [As a side bar, using a qqplot requires some assumptions that are not met in the plus-stimulus condition, but nonetheless this is a useful tool to assess the shapes of our distributions]. Olfactory receptors are typically thought to be 'activated' by odorants, such that they have a basal, inactive state and an induced active state. In contrast, some other receptors similar to olfactory receptors, such as opsins, are active in the basal state and inactive upon stimulation. What jumps out from the data below is that this model for olfactory receptor activation potentially needs to be updated. While many datapoints are greater than the confidence interval band of the qqplot upon stimulation (top right), just as many or more points are less than the confidence interval band (bottom left). These data suggest that the stimulus I am using in this experiment activates some set of olfactory receptors and suppresses the activity of others. The code is below. This uses the same input dataset as in the first olfactory receptor activity post: 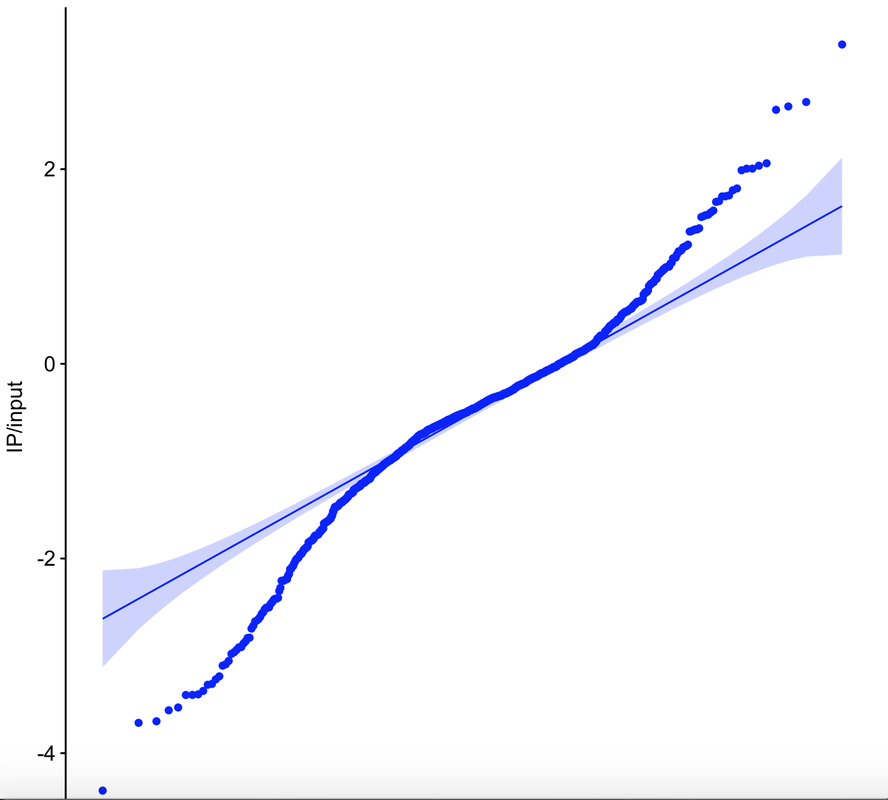
|
 RSS Feed
Proudly powered by Weebly